Northland Study: Emissions Cuts "Unsustainable" for Dairy
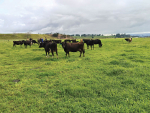
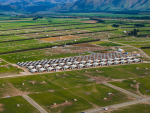
A five-year study has found that the cost of reducing emissions without technology may be significant and unsustainable for Northland dairy farmers.


 increase font size
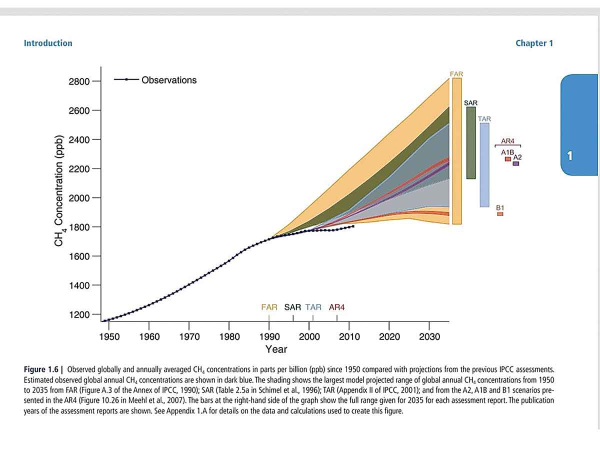 Figure 1.6
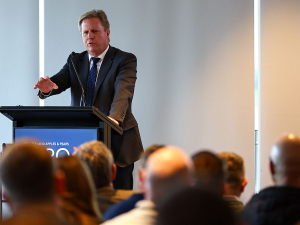
OPINION: New Zealand has said it is going to reduce its greenhouse gas emissions by ‘a lot’ and ‘in a short time’. One of those gases is methane. Our biggest producer of methane is livestock farming.
If you are a farmer of ruminants, or a person working in the sector, there’s a graph you really need to see and understand.
This graph, Figure 1.6, has been hidden where nobody will see it, on page 133 of the 5th assessment report (AR5) of the Intergovernmental Panel on Climate Change (IPCC).
The people who put this graph into the report understand what it means, but they were probably thinking no one would see it, because few actually read the reports.
However, I do read the reports and when I saw the graph I was surprised they were honest enough to include it. I want to explain what this graph means and why it matters.
This is a screenshot of Figure 1.6 from AR5. It shows the amount of methane that the models in the four previous reports said would be in the atmosphere. It also shows the actual observed methane in the atmosphere. The model projections are the shaded areas. The observations of real-world values is the dark dotted line. The observations of the real world end up being below and outside the range of all the model projections. That should not happen. The model projections are not merely based on theory. A model is a mathematical representation of the theory. If the theory is correct, the observations of the real world should always fall within the range of the projections. This is an experiment to test if the theory is true.
As Richard Feynman famously said, “It doesn’t matter how beautiful your theory is, it doesn’t matter how smart you are. If it doesn’t agree with experiment, it’s wrong.”
So, the theory, on which their models are based, is wrong. This matters because this theory is the basis of government policies that are requiring a reduction in methane emissions.
So, what was their theory? They tell us on page 134. They say, “Because at the time the scenarios were developed… it was thought that past trends would continue.”
The basis of their model projections was to extrapolate the past trend into the future.
By publishing this graph, they are saying their theory was wrong. They know their understanding is flawed. Our government’s policies are based on this. The fact methane is produced by bacteria in the rumen is not a mistake. It’s part of the digestion process. But, because of this theory, they plan to vaccinate cows against some of the bacteria that digest their food. What could go wrong?
Methane emissions from us are supposed to be 60% of the total. Natural emissions are supposed to be reasonably constant. But if that were the case, we should expect to see a rise in methane in the atmosphere when our emissions rise.
The fact that this was not observed suggests this change in atmospheric methane was because of natural processes. Which means there is no reason to demonise farming.
We can easily explain how they might have got it wrong. It looks like they have underestimated the natural emissions of methane. Which, to be fair, is easy to do. The official values for total and natural methane emissions are not the result of observations. They are calculated based on theory, assumptions and modelling, about which they admit, there is considerable uncertainty.
Would it not be a good idea to put off imposing costs on farmers until the ‘experts’ can honestly say they have a good understanding of what is happening with methane?
John Riddell is a dairy farmer in Waikato
A five-year study has found that the cost of reducing emissions without technology may be significant and unsustainable for Northland dairy farmers.
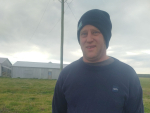
OPINION: With the winter months officially here, I trust all is well at your place.
A hypothesis in a major dairy research programme that bulls genetically proven to be low methane producers could pass this trait onto their lactating daughters has been proven to be incorrect.
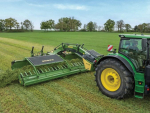
New research suggests sheep and beef farmers could improve both profitability and emissions efficiency by increasing lamb weaning weights, with only marginal changes in total greenhouse gas emissions.
OPINION: The global crusade against fossil fuel is gaining momentum in some regions.
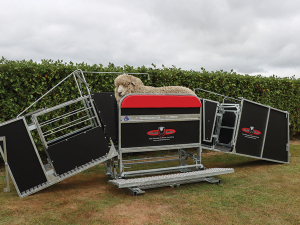
Oamaru-based livestock handling specialist Te Pari has bought Combi Clamp, the New Zealand manufacturer of Combi Clamp manual sheep handlers.
Agriculture Minister Todd McClay has admitted that a scheme bringing workers from Pacific nations to work on orchards has become too hard to navigate but says changes are coming.
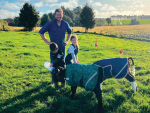
A new app designed in New Zealand aims to help sheep, beef and deer farmers capture, analyse and use body condition score data more effectively.
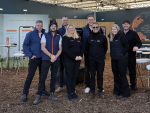
Canterbury farmer Andy Macfarlane has been appointed to the board of AgriZeroNZ, the public-private partnership designed to accelerate the development and deployment of emissions reduction tools for New Zealand farmers.
For over 50 years Mel Ewers has been supporting the apple sector navigate through compliance and quality assurance issues.
The apple sector is enjoying a bumper harvest season.
OPINION: City and regional councils have been put on notice - stop using extreme climate forecasting scenarios that can drive…
OPINION: The Green Party’s rivers and oceans policy may have a new name but nothing else has changed.
![]()